SAS: Probability Plot
The probability plot is a graphical technique for assessing whether or not a data set follows a given distribution. Departures from this line indicate departures from the specified distribution.
To Create a Probability Plot:
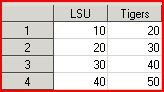
1. Open a new spread sheet and enter all relevant data. For more help click HERE.
2. Next, go to Graphs and click Probability Plot.
3. Select the column titles to add to the Probability Part and click Analysis, then click OK.
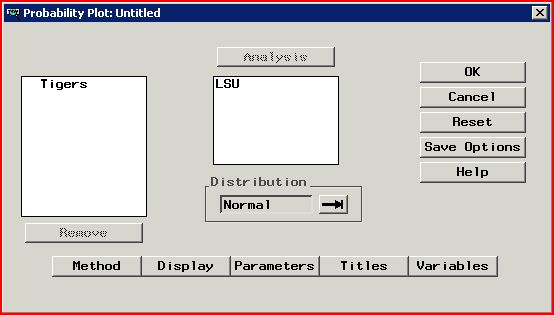
4. Click OK and a probability plot should then appear.
Referenced from: Support.sas.com
5128
2/1/2024 3:53:59 PM