SAS: Box Plots
This article has not been updated recently and may contain dated material.
A Box Plot is a graphic representation of a distribution by a rectangle in which the median and first and third quartiles are marked by lines parallel to the ends. The spacing between the different parts of the box help indicate variance, skew, and identify outliers.
To Create a Box Plot:
1. Open a new spreadsheet and enter all relevant data. For more help, visit support.sas.com/en/technical-support.html.

2. Next, go to Graphs and click Box Plot.
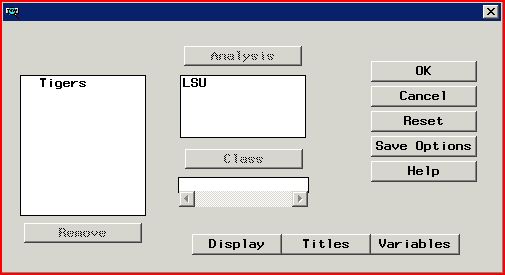
3. Select the title from the menu you wish to add to the Box Plot and click Analysis.

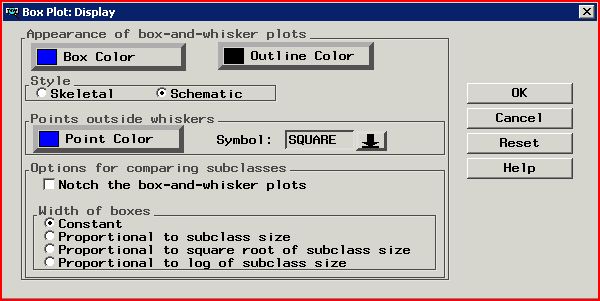
4. Next, click Fit and select Schematic in the Style category. Then click OK.

5. Click OK once more and a Box Plot will open.
Referenced from: Support.sas.com
5127
9/30/2024 9:01:35 AM