SAS: Summary Statistics
Summary Statistics are used to summarize a set of observations in order to communicate possibilities about the data such as: the measure of location, variance, range, and absolute deviation.
1. Open a new spread sheet and enter all relevant data. For more help click HERE.
2. Next, Click on Statistics and go to Descriptive and then select Summary Statistics.
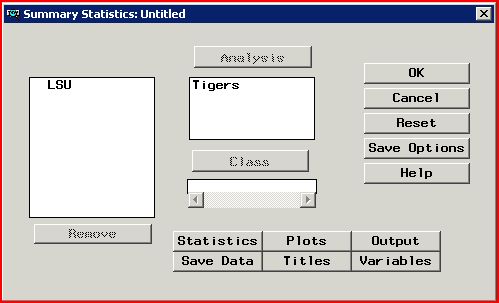
3. Select the column titles to add to the Summary Statistics and click Analysis.

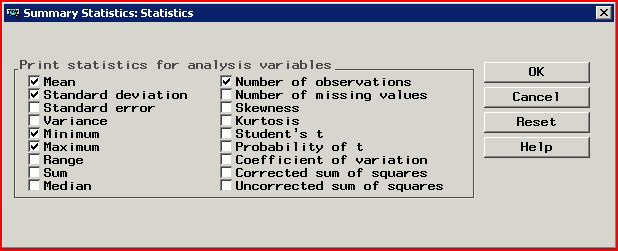
4. Next, click Statistics and select all the calculations to include in the summary. Then click OK.

5. Click OK once more and a table should appear showing all the specified calculations.

Referenced from: SAS
5129
2/5/2025 11:32:11 AM